MJO-like forcings at different longitudinal locations drive the SSWs to different fates: interaction with the mid-latitude jet zonal asymmetry
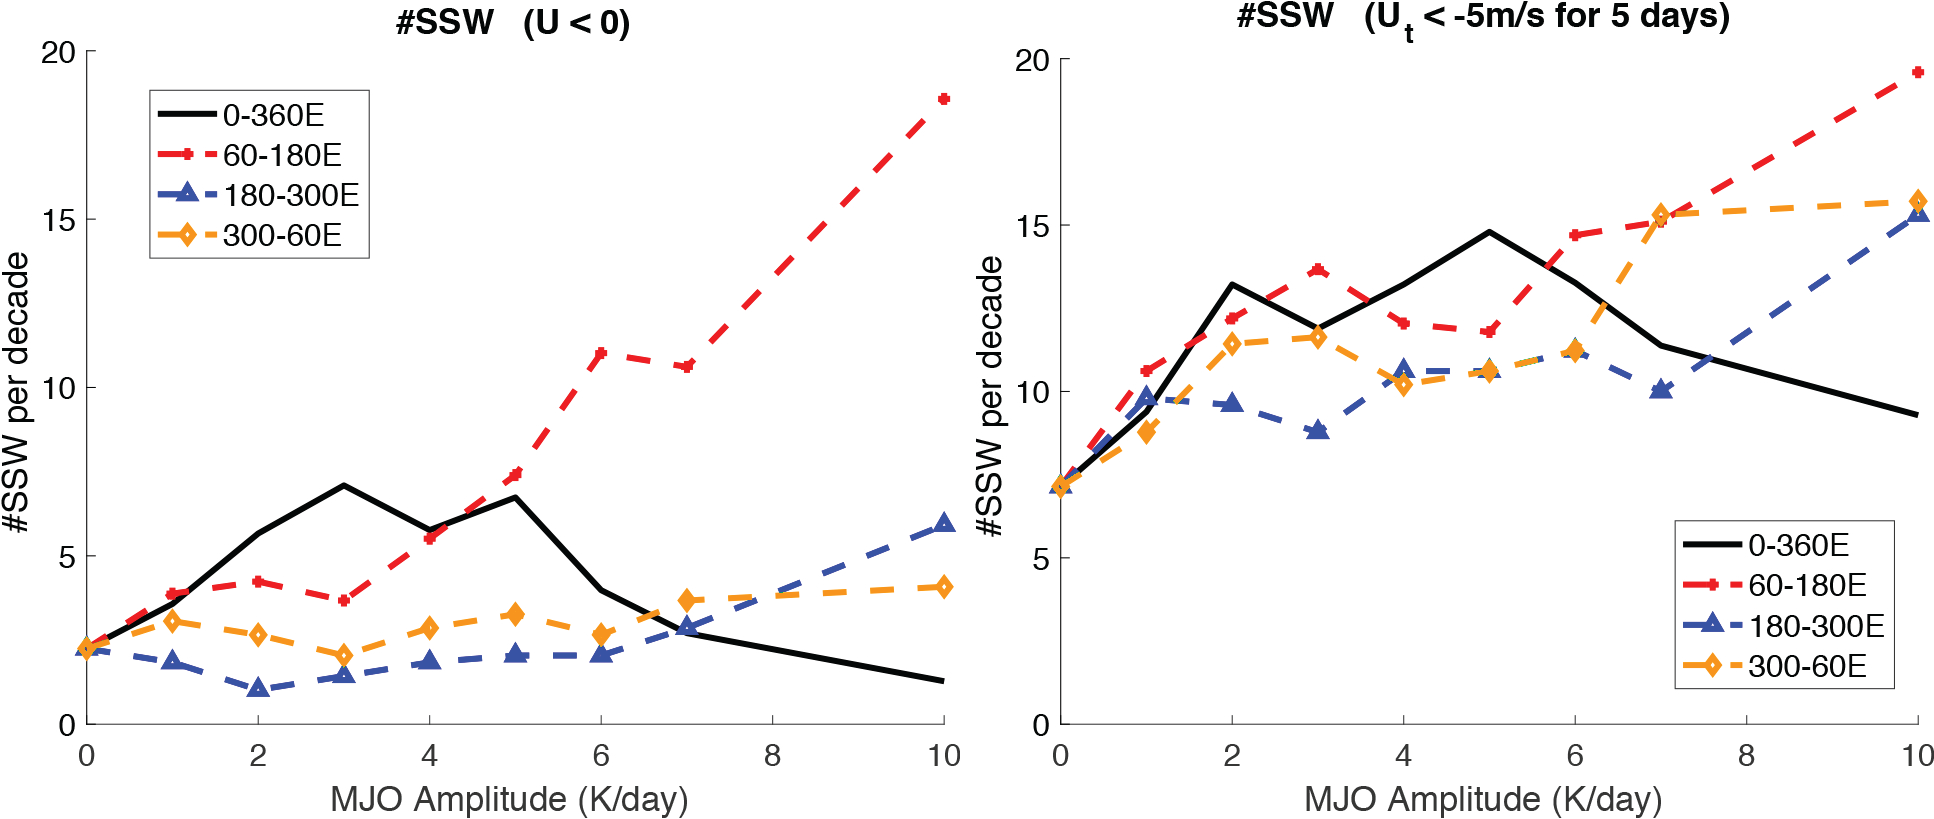
The zonal asymmetry of the MJO forcing itself also plays a role. In response to a circumglobal MJO-like forcing, or a longitudinal restricted one located at different locations, the SSWs can be either enhanced or suppressed [5]. Forced by circumglobal MJO-like forcing with increasing amplitude, the SSW first gets enhanced then suppressed as shown in the black solid curve below; this is a result of the competition between the enhancement mechanism and the suppression mechanism.
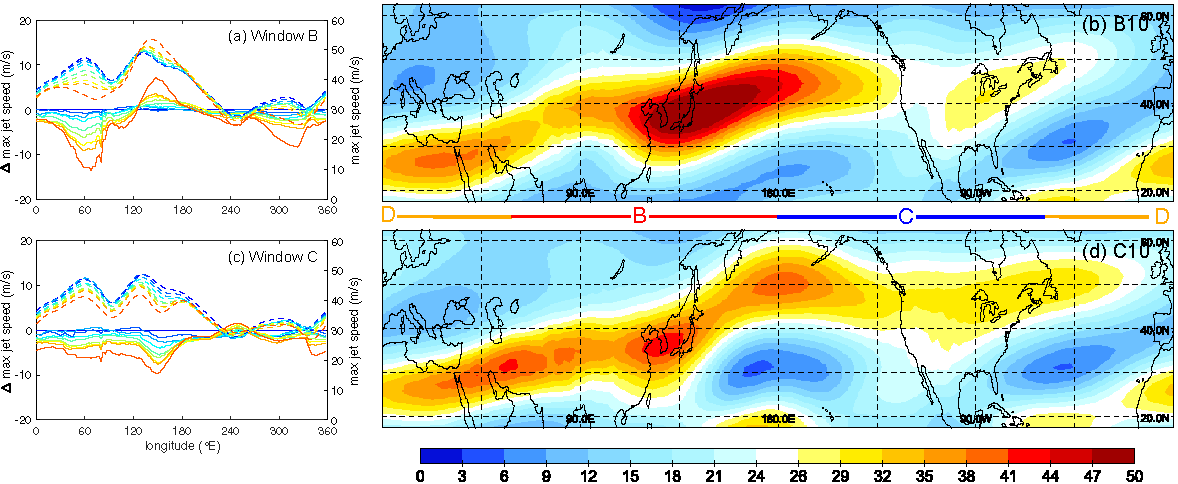
Fig.7: SSW frequency as a function of the MJO amplitudes for forcings restricted by different longitudinal bands. (Left) uses the wind reversal SSW definition, and (right) identifies SSWs whenever the wind deceleration is stronger than -5m/s/day for 5 days. Copied from [5].Direct transmission of MJO-excited waves, modification of the stationary pattern in the mid-latitude, and the amplitude of the mid-latitude generated transient waves, all three of them play a role in determining the SSW’s fate. The key process controlling the MJO impact on SSW was found to be the strengthening and weakening of the stationary pattern through the interaction with the MJO forcing. Shown below are the mid-latitude jet response to MJO forcing restricted in B window (where the current MJO forcing located at) and C window (where the future MJO is predicted to expand to). The former (latter) strengthens (weakens) the stationary pattern in the jet, and ends up enhancing (suppressing) the SSWs. Notice that the MJO-excited waves contribute in both cases to enhance SSWs.
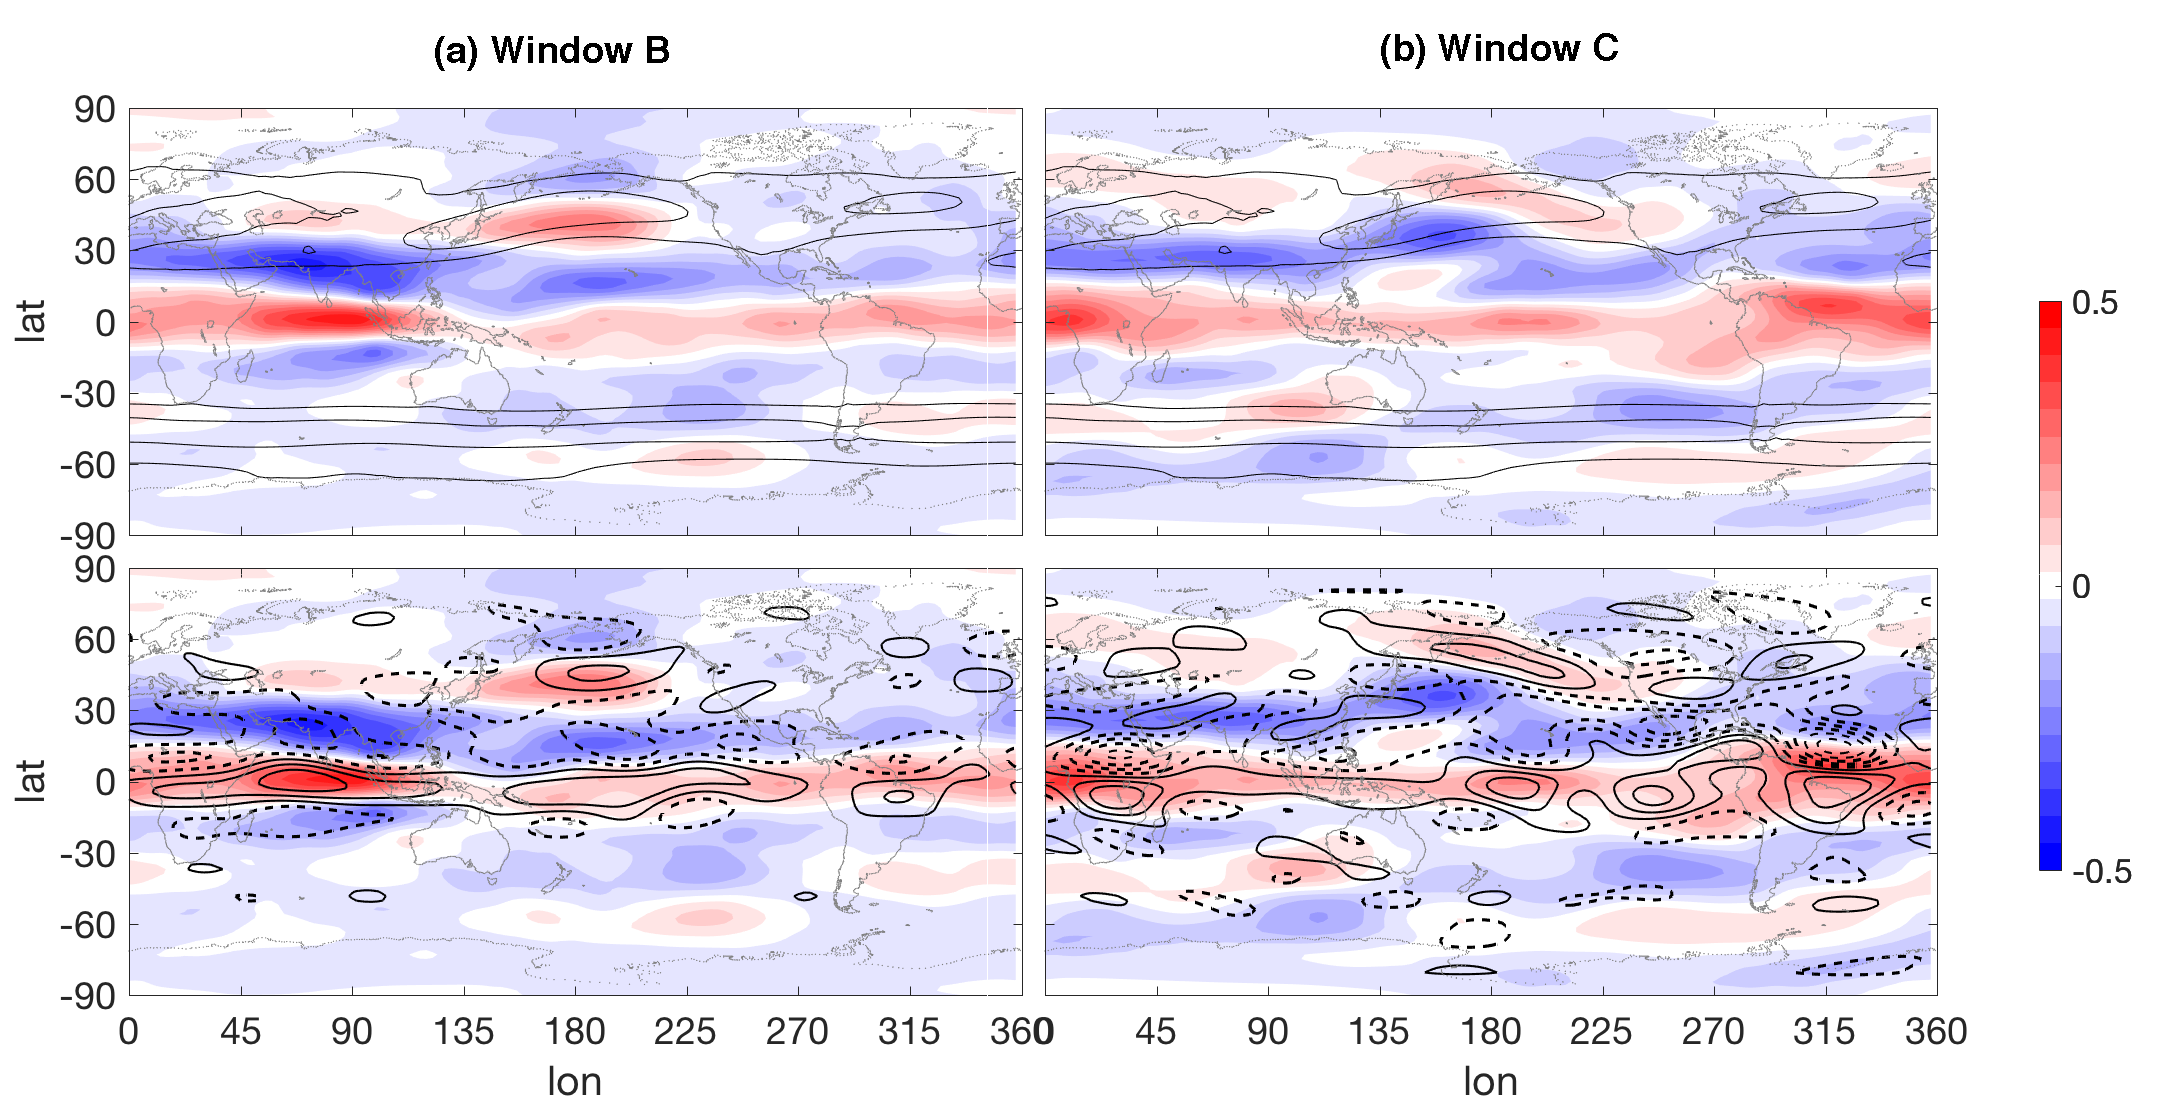
Fig.8: (Right panels): Jet structure (250mb U wind)after adding 10K/day MJO forcing in B window and C window. (Left panels): the jet center speed as a function of longitude for different MJO amplitudes in dashed lines; and the difference from the unforced control experiment in solid lines. Copied from [5].What happens in the transition stage from the unforced background flow to the forced one? We ran 800-ensemble simulations starting from different initial conditions, with the MJO-like forcing turned on at t=0 (initial MJO phase is different from one and another), and closed the momentum budget. The results indicate that the eddy momentum transport, u’v’, drives the climatology response.
Fig.9: (Top panels) show the U250 wind response due to the MJO forcing in (a) window B and (b) window C, with the unforced control U250 profile overlaid as contours. (Bottom panels) show the same U250 response in shading, but show the U wind tendency due to u’v’ eddy momentum transport in contour; the matching indicates the dominant role played by u’v’. Copied from [5].